Pages in this section:
1️⃣ Section 1: Getting started
🆕 What is new
🆘 Getting help
➡ Causal mapping
🗺 Causal maps
✅❌ Pros and cons
🧮 Coding with Excel
💻 What you need
📲 Signing up
👤 Account
👭 Received a share?
🕑 First 5 minutes
👩💻 Coding
🌗 Statements Filters
🌓 Transforms
✨ Applying Filters
🗺️ Vignette
🗺️ The Map
📊 Tables
📂 Files
🧾Account tab
👉 Interface tips
All sections:
The Files tab
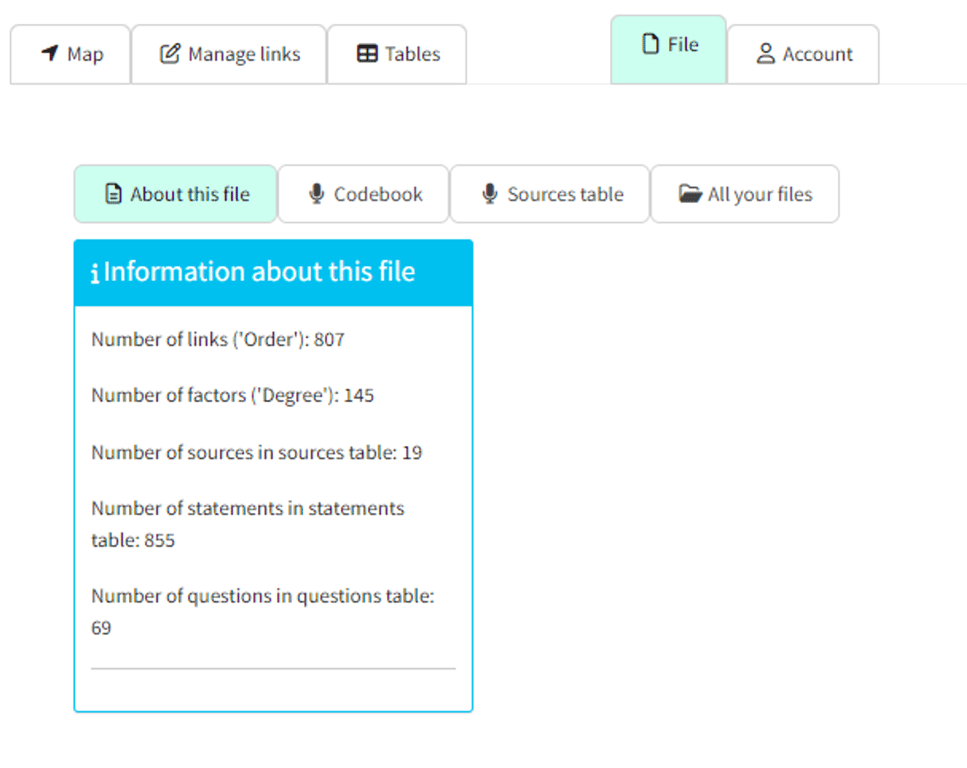
"About this file” sub-page
Show summary data about the current file such as number of factors
🥼 Advanced section (beginners can skip this)
"Codebook” sub-page
Sometimes you might want to work with a pre-determined list of possible factors. This is sometimes called “deductive coding” or “(partially) deductive coding”.
Or you might be working on a larger project with colleagues and you want to periodically share your codebook.
Simply type or paste a list of pre-determined factor labels in the box. They are saved with the file.
These factor labels will then be presented as options when you code.
"Source data table” sub-page
When you upload data, you can optionally provide a table of sources., in the
sources tab of your Excel file, order to provide additional information (e.g. sex, age, location, education, etc) about them (see Uploading data). This information is merged into the information about the links so that you can e.g. filter your maps to show only links from women.Fields in the sources table you upload
source_id. A code which is intended to match the fieldsource_idin thestatementstable.
- Other columns such as
genderwith any additional data you want to provide.
Fields added by the app
in current statements- whether any of the current statements, (i.e. those you selected in the 🌗 Statements Filters) come from this source.
in any statements- whether any of the statements in the file come from this source.
has any links- whether any links have been coded for this source.
in uploaded sources- see below
What is the table for?
The main purpose of the table is to provide additional information about your sources.
By looking at the
in current statements and in any statements columns, you can also see which sources provided information for the currently filtered statements, or for any statements in the file. The table can provide a summary of the respondents which can be useful for presenting respondent demographics in the report, either in the sampling section or as an appendix.
Using the table to check your sources information
This table also gives you a way to check whether the sources data you uploaded in fact correctly corresponds to the source IDs implied by the source IDs listed in the statements table.
This table combines the uploaded information for each source ID with any source IDs implied by the statements table.
This table provides a row and a source ID for each source , whether it comes from your uploaded sources data or it is implied by the source ID in 📜 The Statements Table.
- If the source is only implied by the statements table, the column
in uploaded sourceswill have a ❌.
- If the source is only provided in the uploaded sources table, but does not occur in the statements table, the column
in any statementswill have a ❌.
The source IDs in this table will usually correspond to the source IDs in the statements table. So your uploaded sources table might just have rows for the source IDs X1 and X2, whereas in your statements table, you have statements with source IDs X2, X3 and X4: these are the implied source IDs. It's up to you to make sure that the source IDs match the source ids in the statements table.
The uploaded and implied source IDs are not always the same. It's quite normal for them to be out of sync.
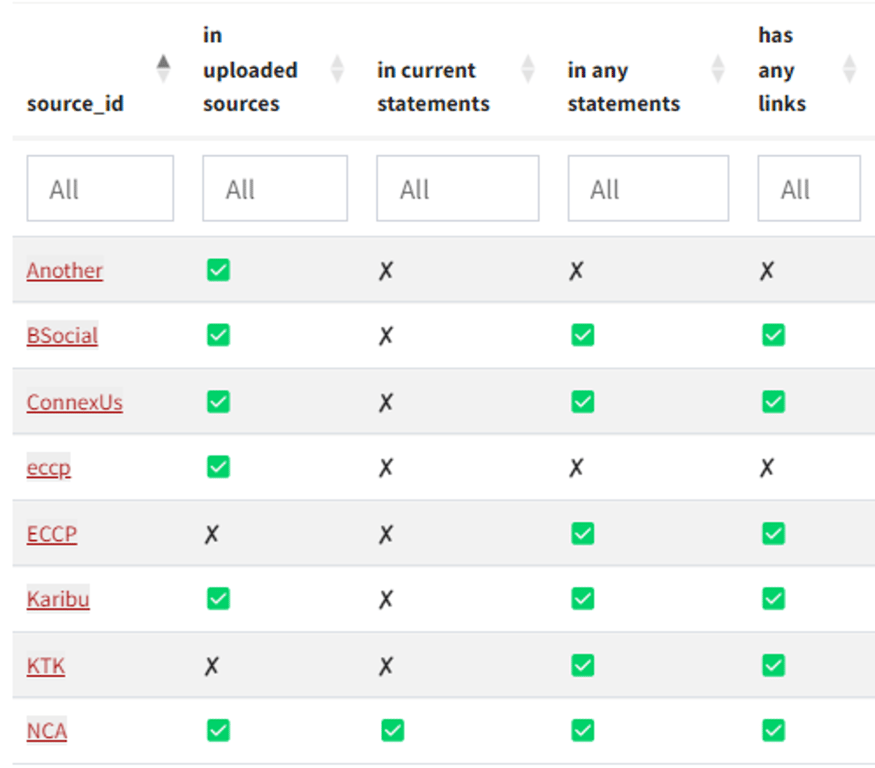
If you see a ❌ in
in uploaded sources this might be because- you are planning to upload some or all of the sources data later, or not at all.
- there is a typo and the implied and uploaded source IDs do not quite match, as in the example “eccp” and “ECCP” above.
- you accidentally missed a source in your uploaded data - perhaps this is the reason why KTK is missing above.
If you see a ❌ in
in any statementsthis might be because- you upload all your sources at the start and only upload statements batch by batch.
- there is a typo, as above
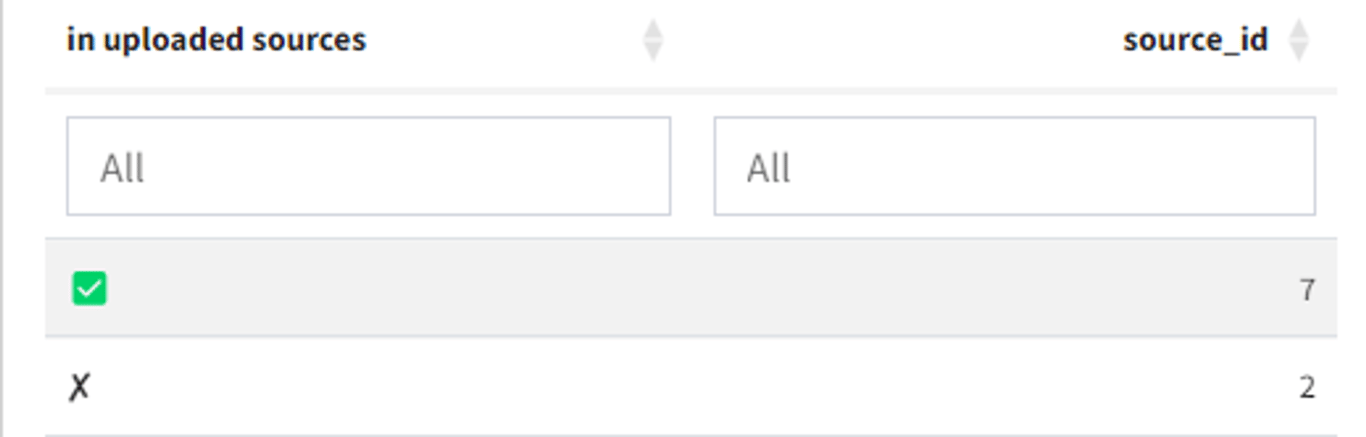
You can play with this table as usual — see 📊 Tables — you can filter and sort columns, or you can group by rows and columns like this:
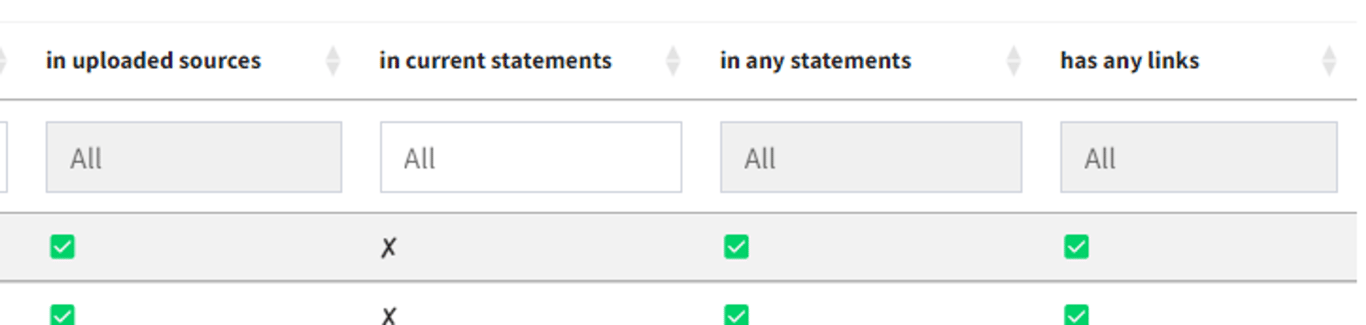
🔥 Tip: Remember that if all the rows in one column have the same value, the filter field is greyed out, like all except the second column here. That gives you a quick visual check that in this case, all the source IDs are listed in the uploaded sources data, have at least one statement and have at least some links.
"All your files” sub-page
Manage all your files and show summary data about the current file such as number of links. As usual you can sort this table by clicking on the headers, search all the text, or filter individual columns.
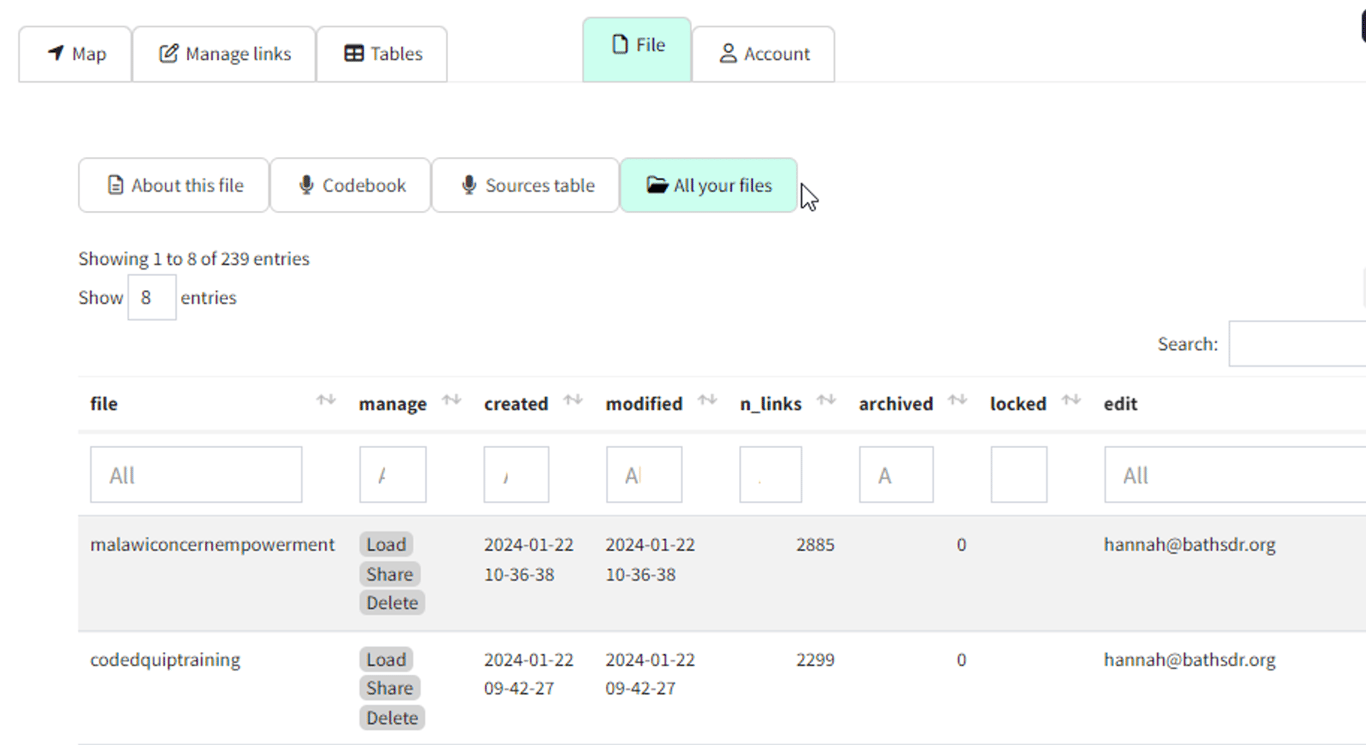
These three buttons are useful:
- Load: load the file
- Share: open a dialogue to control who can see and edit the file
- Delete: delete your file permanently (!)
⚒️ What the metrics mean
There are quite a few metrics, some are more self-explanatory than others. The table below expands on the brief description given in the metrics table.
🎓Metrics with this “mortar-board symbol” are well-known network metrics.
Metric | Explanation |
size | The total number of links in the map. |
order | 🎓The total number of factors in the map. |
links_per_factor | The average number of links per factor. Usually, you want to have plenty of links per factor. |
n_statements | The number of statements in the map. |
n_words | The total number of words in all the statements. |
n_coded_words | The number of words in coded phrases. |
n_characters | The number of characters in all statements. |
links_per_statement | The number of links per statement. |
percent_coded | The percentage of statements which have been coded. |
component_count | 🎓The number of unconnected components in the map. Do you have islands in your map? The app first identifies the components – sets of factors which are all (“weakly”, i.e. ignoring the direction of the links) connected to each other by some path; then counts how many separate components there are, i.e. none of the factors in one component are connected to any of the factors in the other component(s). |
diameter | 🎓The length of the longest geodesic or path between two factors. For example, the count for the very simple map consisting only of A->B->C->D would be three, as it’s three links from A to D. This takes into account the direction of the arrows. |
reciprocity | 🎓The proportion of mutual connections in the map. This calculates the proportion of factors in which both factors influence one another. The connection must be between two factors, feedback loops are not counted. |
min_cut | 🎓The minimum number of links that you would have to remove to split the map into two clusters. |
mean_dist | 🎓The mean number of links between all factors in the map. |