Pages in this section:
1️⃣ Section 1: Getting started
🆕 What is new
🆘 Getting help
➡ Causal mapping
🗺 Causal maps
✅❌ Pros and cons
🧮 Coding with Excel
💻 What you need
📲 Signing up
👤 Account
👭 Received a share?
🕑 First 5 minutes
👩💻 Coding
🌗 Statements Filters
🌓 Transforms
✨ Applying Filters
🗺️ Vignette
🗺️ The Map
📊 Tables
📂 Files
🧾Account tab
👉 Interface tips
All sections:
Simple causal mapping with Excel
Summary
Most people will probably skip this page, but if you are interested in learning about the basic ideas of causal mapping without using our app at all, but just using a spreadsheet program, read on!
You will learn:
- How to do causal mapping with Excel
- How to upload causal mapping data from your own Excel file to Causal Map where you can analyse it and visualise the data. Or you can use other software like Gephi for visualisation.
- Remember that uploading and analysing data in Causal Map is completely free: you only need a subscription for using the Causal Map interface for coding your data.
Download our example Excel file
Now we are going to back to the basics of causal mapping. You don’t need Causal Map App, or any other dedicated application, to do causal mapping. You can use Excel or any spreadsheet program.
Causal maps store information about links of causal influence between two or more factors alongside the evidence for each link. We call the chunks of text, for example from interview transcripts, which potentially contain claims about causal connections, “statements”.
Here is an example Excel file, it contains example statements from our standard example file. You can use it to practice manual causal mapping.
There are several tabs, but the only ones you need to change are
links and codebook. The
links tab already contains a couple of example links, otherwise known as an edge-list, the starting point for any causal map. The factors in the from_label column affect the factors in the to_label column. For example, the from_label column contains influence factors such as Improved/increased crops which influence the consequence factor in the next column, like Increased income. It is these links that could then displayed in a causal map.You will notice, in this example, that the columns in the links tab are dropdown lists when you click on the triangles in each cell. These dropdown lists are fed from the labels listed in the
codebook tab. So you can change the options available by editing or adding labels in the factors tab. But you can also add new labels simply by typing in the cell. Doing your own coding
So to actually do your causal mapping, you need to make sure that the
statement_id and statement_text columns in every row in the links tab correspond to a statement_id and text from the statements tab. You might want to start out by copying all of the rows (but just the first two columns) from the statements tab into vacant rows in the links tab. Don’t actually edit anything in the statements tab (or the sources or questions tabs). 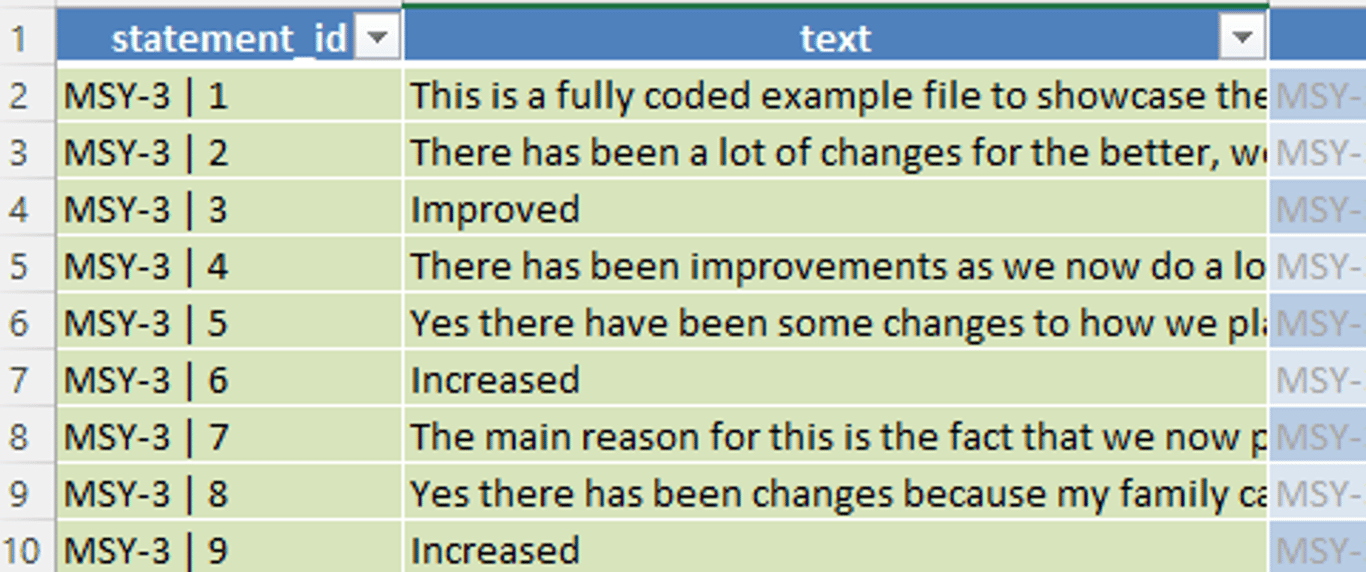
statements tab. Then,
- identify an actual causal claim within the
statement_textcolumn.
- Copy the piece of text which is evidence of the causal claim into the
quotecolumn.
- Type or select the
from_factorandto_factorlabels to show what causal factor did the influencing and what causal factor was influenced. If you want you can use hierarchical and opposites coding just like in the Causal Map app.
As you can create several links for one statement, the same
statement_id and statement_text can be repeated several times, usually with different quote, from_label and to_label. It doesn’t matter if you have rows in the links table which don’t have any entries in the quote, from_label or to_label columns; they will be ignored when you upload your data to Causal Map. If you want to create an extra link from an existing statement,
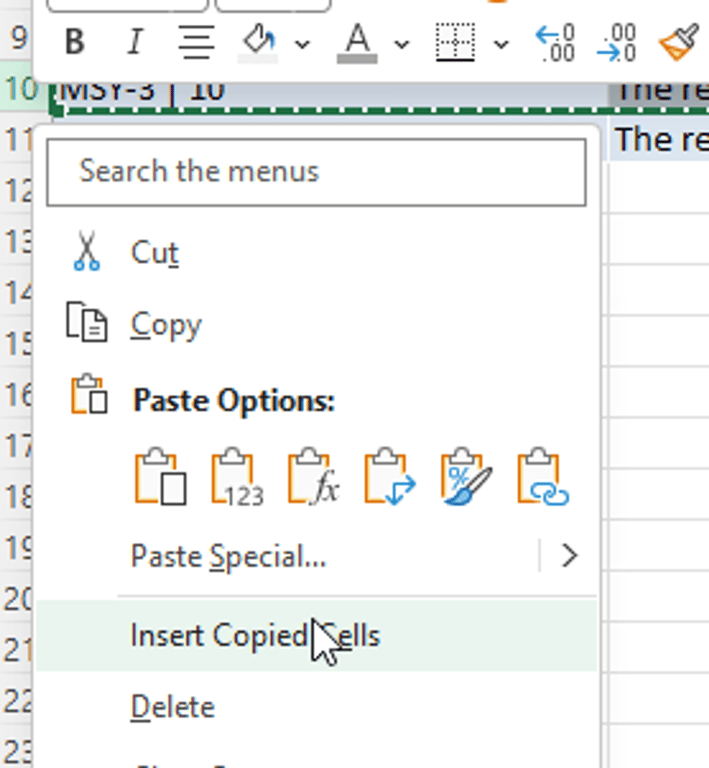
one easy way is to simply copy the row, then right-click on the left-hand border of the Excel sheet around the row where you want to add a new row, and press “insert copied cells”. Remember to change the
quote, from_label and to_label for your new link. You can download the example file play around with it or use it as a template for your own map.
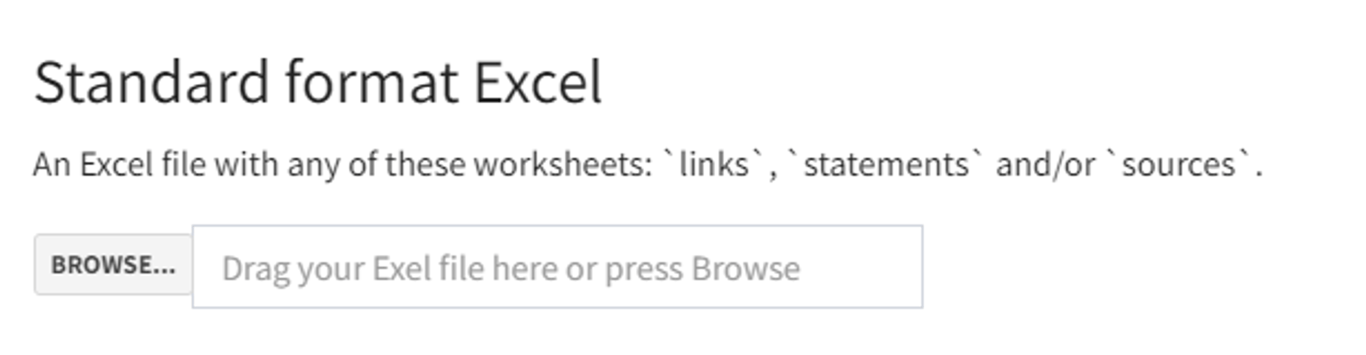
Uploading your file to Causal Map
When you’ve done some coding, you can upload the file to Causal Map to visualise it.
The app will also import the additional data from the
sources and questions tab so you can do simple and sophisticated visualisations and analyses and apply special filters. If you later do some more coding in the same Excel file and want to upload the more complete data set, just remember to press
Overwrite not Append when you upload. Visualising your data with other tools
Also once in excel format, your data becomes compatible with other data visualisation tools like Gephi. If you want to know more about that check out the video below on using the causal map app alongside other data visualisation tools.
Things to think about: drawbacks of using Excel
Causal mapping using Excel is pretty simple but of course it isn’t as convenient as in a dedicated app.
- You’ll notice that if you create a new label in the
from_labelcolumn, it won’t be suggested as a label in theto_labelcolumn, and vice versa. After you’ve done a bit of coding, you’ll probably want to look through the labels you’ve created in these two columns, tidy them up a bit, and add any new labels to thecodebooktab so that they will be provided as suggestions as you continue to code.